

CoreLogic’s Home Value Index continues to lose steam as the case for higher interest rates mount
- Written by Corelogic
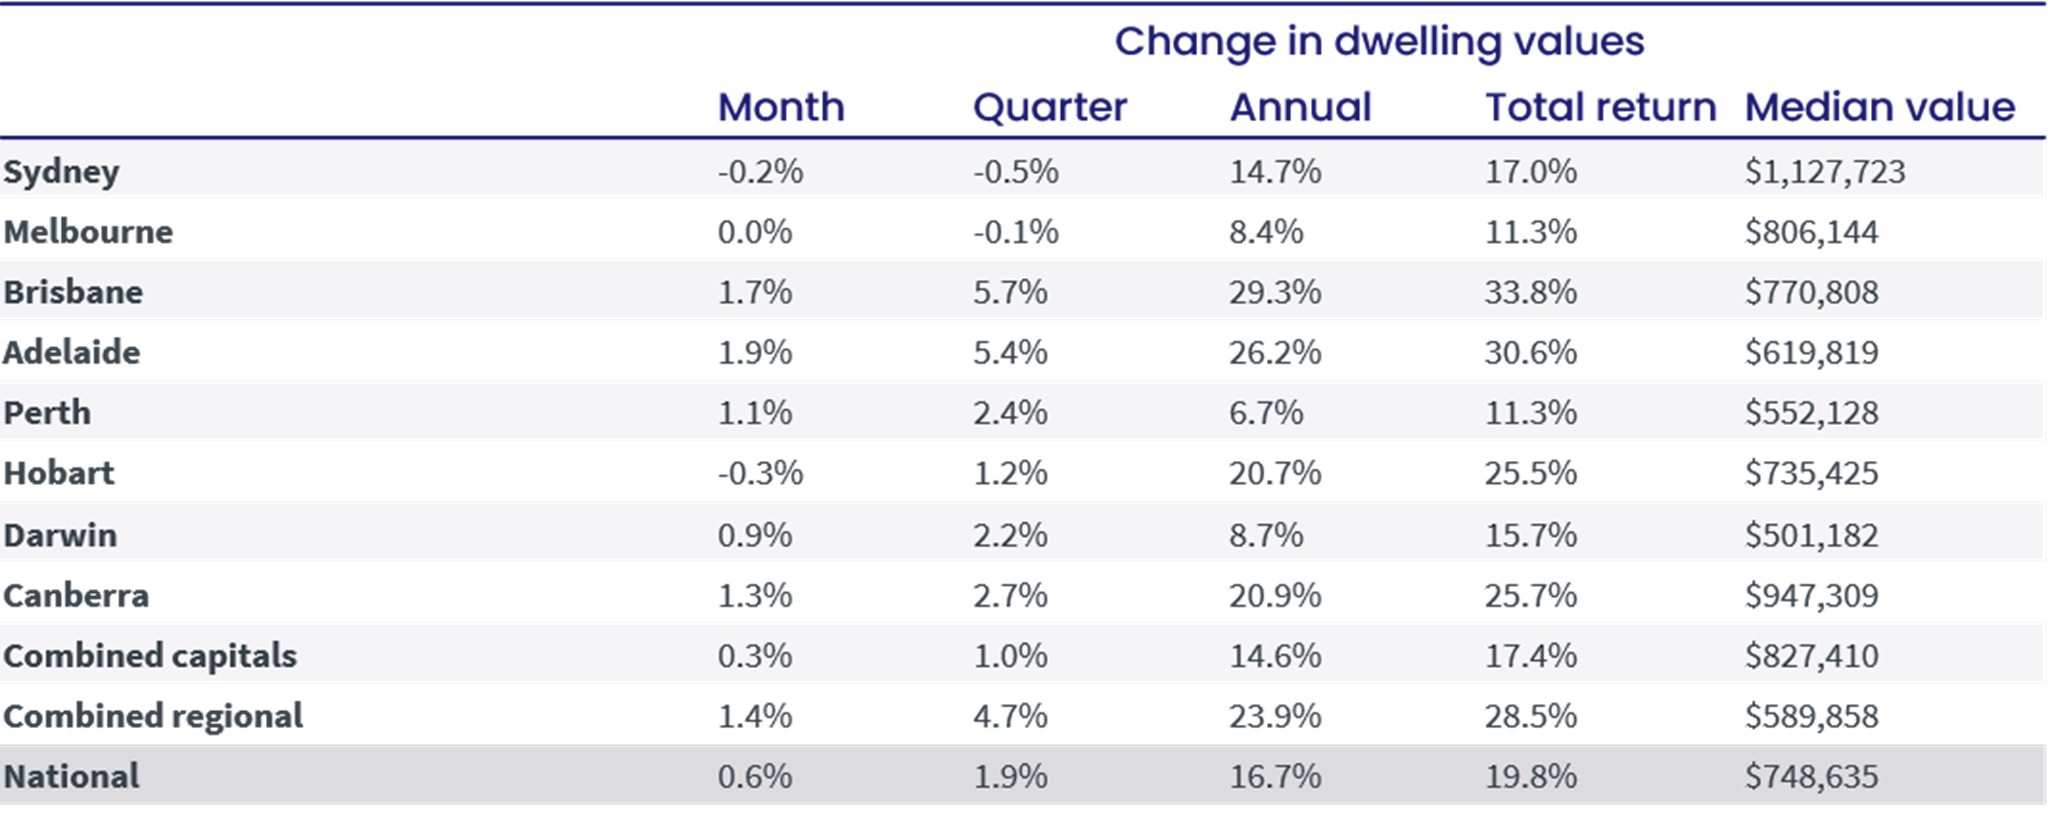
The residential property markets of Australia’s two largest cities have hit their first quarter of negative territory since the extended lockdowns of 2020. Sydney and Melbourne’s market slowdown has seen CoreLogic’s national Home Value Index (HVI) continue to lose steam through April. Housing values are still rising at the national level, however the 0.6% monthly rate of growth is the lowest reading since October 2020.
Sydney and Melbourne, which have the heaviest weighting in the HVI, were the main drag on the headline growth rates. Sydney housing values recorded the third consecutive month-on-month decline, down 0.2%, while Melbourne values were flat (-0.04% when taken out to the second decimal place). Technically values are down over three of the past five months in Melbourne. Hobart also recorded a negative monthly change (-0.3%), the city’s first monthly fall in 22 months.
CoreLogic’s Research Director Tim Lawless says the weakening state of the market has taken the rolling quarterly trend into negative territory across Sydney and Melbourne for the first time since these cities were in the midst of extended lockdowns in mid-to-late 2020.
Demonstrating the diversity in housing conditions across the broad regions of Australia, half of the capitals are still recording a monthly growth rate above 1%. Adelaide, at 1.9% growth in April, led the pace of capital gains, followed by Brisbane
(1.7%), Canberra (1.3%) and Perth (1.1%).
Although monthly growth rates remain high in these markets, Mr Lawless warns the trend rate of growth is easing in most of these areas as well. Based on rolling quarterly change, Brisbane dwellings moved through a peak rate of growth in December last year at 8.5%, slowing to 5.7% over the most recent three month period. Similarly, Adelaide moved through a peak in the trend rate of growth in January at 7.4%, reducing to 5.4% in April.
Perth and Darwin are the exceptions, where the rolling quarterly trend has gathered some steam since late last year. Perth housing values were up 2.4% over the three months ending April compared with a recent lull through late last year when the quarterly trend fell to just 0.4%.
“A rebound in migration rates as state and international borders re-opened could partially explain the renewed exuberance, along with persistently low advertised stock levels and strong economic conditions,” Mr Lawless says.
“While ABS internal migration data by greater capital city is currently only reported to June 2021, the data points to a vast uplift in internal migration to Perth for the year (6,468), a substantial turn-around from the previous four-year average (-3,735).”
Regional Australian housing markets have been somewhat insulated from the slowdown, with housing values up 1.4% in April across the combined regionals index, compared with a 0.3% gain across the combined capitals. Advertised stock levels remain 42% below the previous five-year average in the regions, while the volume of home sales is holding 20% above the previous five-year average. The imbalance between available supply and demonstrated demand is a key factor supporting growth in housing prices across Regional Australia, however the trend rate of growth is generally slowing as affordability constraints become more challenging.
The annual growth trend in home values is now falling sharply, with the national reading dropping from a recent peak of 22.2% growth over the year ending November 2021, to 16.7% over the most recent 12-month period.
As the stronger months of capital gain from early 2021 fall out of the 12-month calculation, Mr Lawless says we will see the annual change reducing more sharply over the coming months.
“With the RBA cash rate set to rise, potentially as early as tomorrow, we are likely to see a further loss of momentum in housing conditions over the remainder of the year and into 2023,” he says.
“Stretched housing affordability, higher fixed term mortgage rates, a rise in listing numbers across some cities and lower consumer sentiment have been weighing on housing conditions over the past year. As the cash rate rises, variable mortgage rates will also trend higher, reducing borrowing capacity and impacting borrower serviceability assessments.”
Index results as at 30 April 2022